Most organizations capture the data that matters least completely, and the data that matters most barely at all. Here's a four-tier framework for finance and revenue leaders to find the gap — and the highest-ROI way to close it.
Every CFO has been handed a sales forecast they didn't quite believe and had to fund anyway. The problem isn't the sales team's optimism — it's that the data underneath the forecast is incomplete, and incomplete data can't produce reliable intelligence no matter how sophisticated the dashboard on top of it. Before you invest in another analytics tool, it's worth asking a more fundamental question: which customer data actually drives revenue, and how complete is yours? This is the revenue intelligence framework that answers it.

Finance leaders are increasingly accountable for revenue predictability, not just reporting. But you can't forecast, model, or optimize what you can't see — and most organizations have large blind spots in their customer interaction data. As we've quantified in why dirty CRM data costs more than you think, incomplete data doesn't just weaken one report; it compounds through every downstream decision. This framework gives finance and revenue leaders a structured way to think about which data matters and what completeness is worth.
Not all customer data is equally valuable. The framework sorts it into four tiers by revenue impact, so you can focus completeness efforts where they actually move the number.
What was actually said in customer conversations — the objections, commitments, competitive mentions, and buying signals. This is the highest-value data because it's both the most predictive and the least captured. It's the intelligence that, as we've documented, reps discover every day but never log. Completeness here has the largest effect on forecast accuracy and win rate.
Who did what, when — calls made, meetings held, emails sent. Most CRMs capture some of this automatically, but the gaps (especially uncaptured field interactions) distort the picture. Activity data is moderately predictive and moderately captured; the value is in closing the gaps rather than in the data you already have.
Stages, amounts, close dates. This is what most forecasting runs on, and it's the most complete — but also the most gameable and least explanatory. Pipeline state tells you where a deal is, not why, which is why forecasts built on it alone are brittle. Tooling that improves pipeline accuracy helps, but only when fed by the richer intelligence in the tiers above.
Industry, size, geography, tech stack. Useful for segmentation and targeting, largely static, and widely available. It's the most complete tier and the least differentiating — necessary context, but not where revenue intelligence is won or lost.
The framework reveals an uncomfortable pattern. The data that most drives revenue — Tier 1 interaction intelligence — is the data organizations capture least completely. The data they capture most completely — Tier 4 firmographics — drives revenue least. Most companies have their completeness exactly backwards, investing analytics effort on the tiers that are already complete while the high-value tier stays sparse.
This is why buying another dashboard rarely fixes forecasting. The dashboard reorganizes data you already have (Tiers 3–4) without addressing the missing intelligence (Tier 1) that would actually make the forecast predictive. The cost of manual data entry is precisely what keeps Tier 1 incomplete: it's the hardest data to capture, so it's the data reps skip.
Because Tier 1 is both the most valuable and the least complete, its gaps drive the largest hidden costs.
The highest-ROI move in revenue intelligence isn't a new analytics layer — it's completing the tier that drives revenue most and is captured least.
Tier 1 stays incomplete because capturing it manually is slow, so reps don't. Remove the friction and the data appears. Voice-to-CRM lets reps speak the substance of each customer conversation in seconds, structuring the interaction intelligence into the CRM automatically. It attacks the single highest-value completeness gap directly — turning the tier you capture least into one you capture most.
Track interaction capture rate as a first-class finance metric, distinct from pipeline coverage. When Tier 1 completeness becomes a number leadership watches, the intelligence quality of every downstream forecast and model improves with it.
Once Tier 1 is complete, the analytics investments actually pay off — because the tools finally have the predictive data they were designed to use. Grounded in a coherent sales execution stack, the framework turns from a diagnostic into an operating model: complete the high-value data first, then let the analytics layer do its job.
Revenue intelligence isn't about having more data — it's about having the right data completely. The framework gives finance and revenue leaders a way to see that most organizations are data-rich in the tiers that don't matter and data-poor in the one that does. Fix that inversion — complete Tier 1 interaction intelligence — and forecasts become readouts instead of negotiations, analytics investments finally return, and finance gets the revenue predictability it's now accountable for.
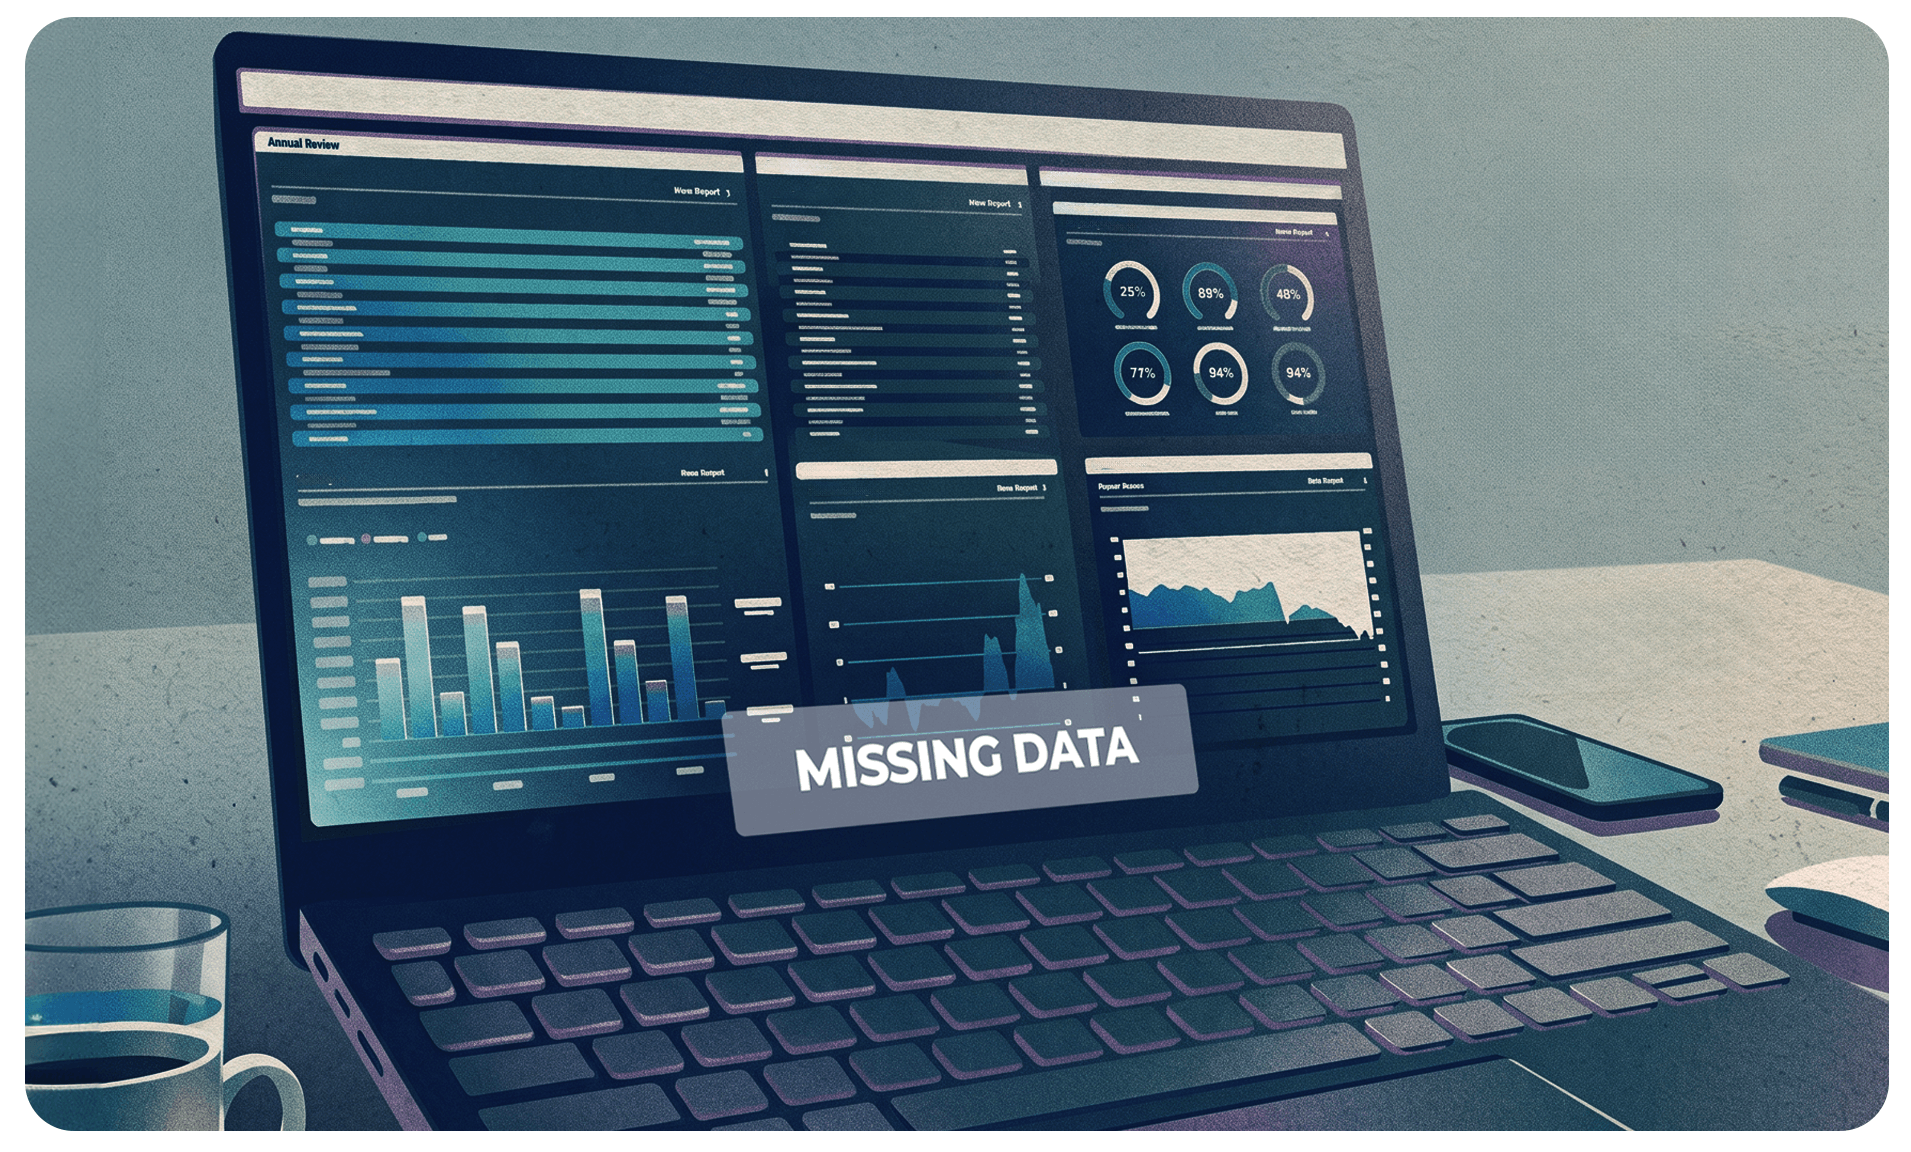
A finance team frustrated by chronic forecast misses invested in a well-regarded revenue-analytics platform. It ingested the CRM, layered on predictive scoring, and produced elegant dashboards. Six months later, the forecast was still missing by double digits, and the CFO was still funding a number nobody trusted.
The diagnosis, when they finally ran it, was simple. The platform was excellent at reorganizing Tier 3 pipeline state and Tier 4 firmographics, the data they already had in abundance. It could do nothing about the Tier 1 interaction intelligence that was never captured in the first place. The reason deals were slipping, the competitor entering here, the champion going quiet there, the budget freeze mentioned on a call and never logged, lived nowhere in the data the platform analyzed. They had bought a more sophisticated lens for looking at the wrong tier.
Only when they addressed capture, making it effortless for reps to record what was actually said, did the forecast start converging on reality. The analytics platform they already owned suddenly worked, because it finally had the predictive data it was designed to use. The lesson is the one at the heart of this framework: completeness in the high-value tier beats sophistication applied to the low-value tiers, a pattern consistent with what we found on the true cost of dirty CRM data.
Finance and revenue leaders can locate the inversion in their own data with a structured audit:
Not on their own. Analytics tools reorganize and interpret the data they are given; they cannot analyze intelligence that was never captured. If the highest-value tier is sparse, a more sophisticated tool produces more confident conclusions from the same incomplete foundation. The fix is completing the data first, then applying analytics.
A recording is raw and unstructured; it sits in an archive and is rarely reviewed. Interaction intelligence is the structured, retrievable substance of what was said, the objection, the competitor, the commitment, captured into the CRM where it feeds forecasts and surfaces at the point of decision. Having recordings is not the same as having captured the intelligence in them.
Almost always Tier 1. It has the highest revenue impact and the lowest completeness in nearly every organization, which makes it the single highest-ROI place to invest. Completing it also improves the tiers above it, because pipeline state and activity data become more meaningful when the interaction context behind them is present.
If any of this sounds familiar, the fastest way to understand your own situation is to see how a modern capture layer works in practice. Explore how voice-to-CRM captures every customer conversation — turning what your team says into structured, complete CRM records without the manual data-entry burden.

Hey DAN is the market-leading Voice-to-CRM solution, trusted by more than 10,000 sales professionals and serving 50 of the 60 largest asset management firms worldwide. Founded in 2006, Hey DAN combines fast AI transcription with human verification to turn spoken conversations into accurate, structured CRM records, giving sales teams back hours every week and giving leadership the clean data modern go-to-market strategy depends on.
Follow Hey DAN


